Friday, July 30, 2010

Gold Dives Down, Rallies to Above $1,180

Initially, the gold market liked the second-quarter GDP number of 2.4%. Spiking up to around $1,176 right after 8:40 AM ET, gold then fell down to below the level it was at when regular trading opened. A bobble around $1,171 gave way to a fall all the way down to $1,166.40. The fall started around 9:30, when factory activity for the Chicago region was revealed to have strengthened. The Chicago purchasing managers' index went up from 59.1 in June to 62.3 for this month.

After bottoming a little before 9:40, gold first hesitated around $1,168 and then took off. A large drop in the University of Michigan consumer sentiment index, from 76 last month to 67.8 this month, added fuel to the rise. By 11:00, the metal was above $1,175; a new daily high of $1,177.50 was made shortly afterwards, which was bettered shortly before noon. As of 11:52, the spot price was $1,178.00 for a gain of $11.50. The Kitco Gold Index split the gain into +$10.00 for predominant buying and +$1.50 for weakening of the greenback.

The U.S. Dollar Index, after rising to just above 81.85, turned downwards just before 9:45 AM. The decline was rolling and fairly mild, but it resulted in the Index reaching 81.5. There seemed to be no discernible immediate effect on it from the above-mentioned economic data. As of 12:00, it was at 81.49.

The early-morning spill, in part prompted by good news, was reversed: that shows the current short-term recovery of the metal is fairly solid. Again, bargain levels are exerting their influence.

Update: The rally continued in early afternoon with not much pullback until the top was reached a little after 1 PM ET. At that top, the metal touched $1,184.60. After it, gold fell back a little but still remained above $1,180. As of the end of the pit session, or 1:30 PM, the spot price was $1,181.70 for a gain of $15.00 on the day. The Kitco Gold Index divided the gain into +$14.45 for predominant buying and +$0.55 for greenback weakness.

The U.S. Dollar Index bottomed around 12:30 when it got just below 81.45. Then, it pulled up but could not rise above 81.6. As of 1:30, the Index was at 81.58.

Gold has managed to be in rally mode for most of the pit session, ending it with a strong double-digit gain on the day. There may be some pullback in the electronic-trading hitch, but not enough to make the day's gain less than a double-digit one.


Update 2: The electronic-trading hitch for the end of the week was fairly relaxed, although some fluctuations did take place. For the most part, gold stayed between $1,180 and $1,182, although there were a few poke-ups above and one larger poke-down below. At the end of the week, the spot price was near the top of that zone: $1,181.40, for a gain of $14.90 on the day. The Kitco Gold Index apportioned +$14.50 to the predominant-buying category and +$0.40 to the weakening-greenback one.

Last Friday, the metal closed at $1,189.70. So, again, it closed with a loss on the week. The drop was much less than it would have been had it not been for today's rally, but a loss was still booked. Over the week, gold declined by $8.30 or 0.698%.

The U.S. Dollar Index, after drifting down again to a little below 81.5, managed to rebound after a double bottom at 81.48. The rise wasn't much, but it added to an overall upward tilt this afternoon. As of the close, the Index was at 81.57.

Its daily chart, from Stockcharts.com, shows a down day but not much of one:


The interday range of today's chart is about the same span as the body of yesterday's candlestick. The body of today's is almost nonexistent, indicating a close only slightly below the open. The Index's RSI level, found at the bottom of the chart, is still in sub-30 oversold territory. There's no real sign of a rebound visible on the chart as yet.

As the days tick on, the Index is getting closer and closer to its 200-day moving average - the red line in the middle of the chart. A real technician would point to that level as support, although 81 is also a support level of some potency. As things look better in Euroland, the Euro will keep rising and the Index will keep falling until more quotidian economic reality intrudes. On a purchasing-power parity basis, the Euro is overvalued.

I keep anticipating a probably unsustainable turnaround for the Index, as based upon its oversoldness, but such an eventuality isn't apparent yet.

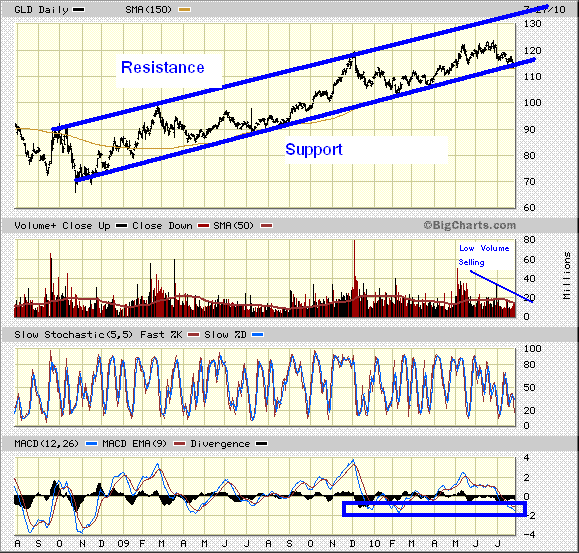
As for gold, its own daily chart shows today's recovery making for three gain days in a row:


The metal has not yet gotten back to the levels it was at before Tuesday's plummet, but it's now close. It wouldn't be too much to hope for the metal to ascend well above $1,180 and stay there, returning to the same short-term range it was at last week. If it does get up to $1,200, albeit unsustainably, then things will get interesting if it stays above $1,180 after the dropback. A few completed reverse head-and-shoulder patterns have been frustrated due to selling cascades, so there's no guarantee even if the metal traces one out in the coming days - but it will be interesting. The summer season's already over the hump, and it remains to be seen if gold's gotten over its seasonal weakness. The current short-term uptrend has potential, although it may be beaten back because the bargain-hunting has diminished.

Last Tuesday, as noted above, was plummet day for gold. The interday low was close to being the low of the week, although Wednesday's was slightly lower. That day's close was the cut-off for this week's Commitment of Traders data, as graphed here. Total open interest declined for the fourth week in a row, although not by much this week. Interestingly, the number of contracts in the non-commercial long category increased slightly. It was commercial longs that shrunk appreciably. The biggest percentage decline, by far, was in the non-commercial short category: the number shrunk by 20.8% from last week's elevated level. Last Tuesday would have been about the time to cover, so the non-commercial short category exhibited some sagaciousness. Of interest is the fact that the change in non-commercial longs was on the right side of the rest of the week. Non-commercial shorts shrunk slightly.

For the Index, last Tuesday saw a slight up day that proved to be the prelude for further drops. Its own CoT data, graphed here, shows yet another decline in total open interest. This week's was the lowest it's been over the last fifty-two. Total longs are actually less than commercial longs were back on September 8th of last year. All categories shrunk, with commercial shorts declining the least. Interestingly, the sharpest-declining category on a percentage basis was non-commercial shorts: that category shrunk by 21.1%. The pullback was the second shrinkage in a row, suggesting that non-commercial shorts see better times ahead for the Index.

Turning back to gold, a post-pit Reuters report said that, despite today's gains, gold ended with the biggest monthly loss since December. Amongst the points made therein, these were included:
* Gold lost about 5 percent in July and was among the top
percentage losers in the commodities complex.

* Gold benefited after data showed U.S. economic growth slowed in the second quarter, raising concerns about the recovery in the rest of 2010.

* Disappointing U.S. GDP report prompted gold investors to cover short positions - Frank McGhee at Integrated Brokerage Services.
It has been a fairly bad month for gold, but the summer decline has still been below average. A lot of this month's was due to the fading of the Eurocrisis, which had made June a gain month. Now that August is approaching, the present short-term turn-up may well continue.

In closing, thanks for stopping by and reading what I've got. May you have a restful weekend, especially if you celebrate the Canadian long weekend.

Moses Kim Expects Parabolic Gold Soon

Unlike Dennis Gartman, Moses Kim is convinced that gold will go parabolic sometime in the near future. He thinks that now is one of those times when supposedly maniacal forecasts will turn out to be right.
I am a big believer that Pareto's law applies to markets. In other words, 20% of inputs will drive 80% of outputs. I honestly couldn't care less about productivity numbers because what's coming is no demand-pull inflation. I am much more focused on the dollar, bond rates, bond/dividend spreads, TIC capital flows, and the stupidity of governments around the world. Of all these variables, I am most confident in my prognostication that politicians will become increasingly foolish as the economic crisis on our hands becomes more complicated.

I have been preparing for the gold rocket launch for many months now. I am probably different from most people in that I focus more on the likely flow of capital than inflation when trying to figure out gold price movements. What I foresee is a flood of capital going from bonds into gold. The bond market is so huge that even a small percentage of capital flowing from bonds to gold will result in a volcanic eruption of epic proportions. So the potential rocket launch in gold depends largely on the bond market.

You all know where I stand. US government bonds are the biggest bubble I've seen in my life. If you are trying to rationalize 10-year yields at 3%, then you are probably the kind of person who rationalized bubble home prices by using the "there's a fixed amount of land but a growing population" argument. In other words, your mind is stuck in the 5th grade. I advise you to think rationally for a second and consider the credit quality of a country that has to monetize its debt in the face of falling tax receipts and a stalling economy. Are you really on the right side of the trade going long bonds?

There will be monumental paradigm shifts in the years ahead. Everyone is asleep, but I think this is going to change fairly soon. The big changes, which will be evidenced by huge moves in gold, are still ahead.

Essentially, he's counting on government officials acting maladroitly and then adding fuel to the fire by panicking.

Mac Slavo Debunks Burst-Bubble Talk

Mac Slavo passes on a Daily Wealth conclusion that gold could fall to as low as $900 and still remain in its long-term uptrend. He also notes that some are saying gold was in another bubble that's burst. He debunks that talk by pointing out that ebbs are normal in a long-term bull market, and it won't be in a bubble until the economic picture is much darker.
We’ve noted before that Gold is often considered to be an inflation hedge. But if you look at the precious metal historically, it’s not inflation (or deflation) that drives gold up, but rather, a loss in confidence. When the private sector realizes that government is not only unable to fix our problems, but complicit in making them worse, that’s when gold really shines.

When the financial, economic, political, and monetary outlook is darkest, that’s when we’ll see the next great gold bubble come to fruition.

So, George Soros will be proven right. As other assets around the world crash - things like real estate, stocks, paper monetary systems and living standards - we’ll see capital flee to the safety of the only wealth preservation monetary asset that has survived the test of time. If you don’t believe, just ask the Greeks why gold was selling at $1700 an ounce only a few months ago.

It will be an extremely volatile ride going forward, perhaps to the point where you’ll hate your gold so much you’ll want to spit on it. But don’t sell unless you’re sure that global crisis has turned to recovery and growth.

Gold will eventually become the ultimate bubble - you can bet on it!
He also points out that gold is nowhere near its CPI-adjusted high of $2,300.

Steve Sjuggerud's Simple Strategy Says Hold Off

Sjuggerud's "Simple Strategy" really is simple. It says to buy gold at the beginning of the month when the price in four major currencies has been up in the previous month. If gold's down in any one of the four currencies, either cash in (for traders) or hold off from buying. The four currencies are the U.S. dollar, the euro, the yen and the British pound.

As for July, it looks like gold will be down in all four currencies. So, the Simple Strategy recommends holding off (or cashing out) at the beginning of August.
This system will be in and out of gold a few times a year. It is a trading system, which shouldn't have much to do with your long-term gold holdings.

On the other hand, if you don't own gold yet, you might want to wait for this system to signal "buy" again... If you do, you'll be buying into what's historically a moneymaking time for gold.

Gold doesn't look great in the short run... Our Simple Strategy says gold could have a rough month in August. The recent gold price trend isn't good.

Big falls in the price of gold are typical in major gold bull markets... A 50% drop is not out of the question.

In my opinion, it's better to wait for gold to bottom and start an uptrend again to buy... Instead of trying to catch a "falling knife," wait for it to hit the ground and settle, then grab it.

In short: Yes, you want to own gold for the long run. But based on the Simple Strategy and the trend, the short run doesn't look promising. Trade accordingly

Of course, mechanical trading systems - like this one - work best when they're not second-guessed. Sjuggerund's Simple Strategy is explained here.

Indian Gold Imports Actually Up On Year-To-Date Basis

Despite the sharp drop in imports for July from the same month a year ago, total imports for the first seven months of this year are higher than those for last year. Imports to India are up 7.8%: 171.6 tonnes were brought in from January to July of this year as compared with the same period last year.

Still, there has been a dearth recently due to traditional summer weakness and higher prices. June's import numbers were lower than July's.

It's Best To Check

As a Telegraph article explains, it's best to check on the holdings of a mutual fund because the names themselves don't always indicate what the funds are invested in.
For instance, you would be forgiven for thinking that the Blackrock Gold & General fund invests in gold. It doesn't, well not directly, but investors won't be disappointed.

It does not invest in the gold price or hold any gold bullion as you may expect, but instead gold and mining equities. This gives the fund greater liquidity and has allowed it to beat the impressive gold price rally over the past five years...

The fund manager Evy Hambro invests up to 30pc of the fund in other mining and precious metals, including platinum and diamonds.
The return can't be quarreled with, but someone investing in that fund seeking exposure to gold itself wouldn't get what (s)he expected. Mutual funds and ETFs are convenient, but there's still some due diligence required.

Bank of International Settlements Discloses Counterparties To Gold Swap

Ten European banks were on the other side of the gold swap, according to a Bloomberg summary of a Financial Times report.
The Bank for International Settlements swapped gold with more than 10 banks in Europe, including HSBC Holdings Plc, BNP Paribas and Societe Generale, to earn a return on its dollar-denominated holdings, the Financial Times reported, citing unidentified European bankers.

The BIS initiated the transactions, asking commercial banks to pledge a gold swap as guarantee for the dollar deposits they were taking from the BIS, the newspaper said.

That may be all to the story, but it seems odd given that the BIS normally deals with central banks.

Two Major Gold Producers Raise Dividends

Both Newmont and Barrick have raised their dividends by substantial amounts. The former bumped it up by 50% to 15 cents per share per quarter, and the latter upped by 20% to 12 cents. At current prices, both yield a little more than 1%.


It's higher gold prices that have done it, along with the lack of margin squeezes due to higher costs. Although gold companies are more prone than most when it comes to dividend cuts, those increases show some confidence in currently elevated profit levels.

Indian Gold Buying Cools Off

According to a report by the Economic Times, Indian gold buying eased off because prices advanced; so did premiums for gold bars.
"Sales today are in less quantity compared to previous days, I did 25-30 deals, in all 150 kgs between $1,160-1,168 (an ounce) yesterday evening," said a dealer with a state-run bank in Mumbai....

Dealers said premiums charged on the market price of the yellow metal could inch higher on the back of contiued offtake from the world's largest consumer of bullion. "It's a seller's market now, for 4 buyers there is only one seller, demand-driven premium would be witnessed in coming days," said Pinakin Vyas, assistant vice-president with IndusInd Bank, a large gold importer.
The article also said premiums on gold bars rose to $1.50/oz from $1.10.


The buying hesitation, which some had feared would take place, hasn't. Evidently, buyers see recent prices as a bargain worth snapping up.

Gold Sneaks Above $1,170

Last night, gold stayed between $1,166 and $1,168 as little gold-related news was disseminated. Climbing above $1,168 a little before 11:30 PM ET, the metal then fluctuated between that level and $1,170 before sneaking up above the latter level around 6 AM. As of 8:05, the spot price was $1,171.40 for a gain of $4.90 on the day. The Kitco Gold Index attributed +$6.20 to predominant buying and -$1.30 to a strengthening greenback.

The U.S. Dollar Index, after drifting last night, briefly descended below 81.5 before undergoing a rally. Starting at just after 3:00, the rally took the Index almost all the way up to 82 befoe it ran out of steam around 6:30. Afterwards, the Index fell back part way; as of 8:11, it was at 81.72.

A Wall Street Journal report says gold continues to stabilize as physical demand kicks in.
"Quite simply, investors are seeking risk and for now gold's safe haven properties have been made redundant," said UBS analyst Edel Tully in a daily report....

Analysts said physical demand has helped put a floor in gold prices this week around $1,160, safely above the 200-day moving average of $1,149.50.

Each time gold dipped below $1,160 this week, it didn't get far before it bounced back, said Rory McVeigh, a precious metals trader at Commerbank in Luxembourg.
The article also mentions holdings of the SPDR Gold Shares Trust stayed steady yesterday.

An earlier Reuters report also ascribes gold's stabilization to physical buying.
"The market is very hot. There's plenty of physical demand and I can't meet the orders. It's from India, Indonesia and Thailand," said a physical dealer in Singapore. "Basically we are seeing buying from jewellers and investors from the Far
East."...

"On a longer-term basis, it will fuel demand for gold if your economic recoveries have stalled. Equities might not perform so well," said Ong Yi Ling, investment analyst at Phillip Futures in Singapore.

"For today, I don't see it going up above $1,175 for the upside. On the downside, I think it should be still supported above the $1,155 level."
The article also points out recent earnings in Euroland companies have bolstered confidence in the economies of the region.

8:30 saw the release of the second-quarter GDP figure for the U.S. economy. The number was slightly below expectations: 2.4%. However, the number for first quarter GDP was revised upwards by a full percentage point: instead of 2.7%, the Q1 figure now stands at 3.7%. The chief drag on the 2Q number was net exports.

The gold market took to it fairly well at first. The metal has slumped down below $1,171 when regular trading began, but it shot all the way up to $1,176.90 between 8:25 and 8:40 AM. Since then, it slid all the way back down plus a little more. As of 8:49, the spot price was $1,170.10 for a gain of $3.60 on the day. The Kitco Gold Index assigned +$4.55's worth of change to predominant buying and -$0.95's worth to a strengthening greenback. The U.S. Dollar Index, after holding steady around 81.75 until 8:32, stumbled at that time but recovered later. As of 8:53, it was at 81.71.

Despite that spill, gold is still holding on to the bulk of its overnight gains. Physical buying has come in, and that demand has led to gold being supported. The metal might rack up its third daily gain in a row.

Thursday, July 29, 2010

Gold Slinks Up In Mid-Morning Trading

The rise was choppy after the daily bottom of $1,159.10 had been reached at 8:40 AM ET, but there was an underlying upwards tendency despite gold's choppiness; it ended at 11:00, but was evident for most of the morning pit session. Just before the peak, it was announced that the Italian government approved a 25 billion Euro austerity package which should protect its credit rating. Focused on public-sector pay freezes, pay cuts for high-earning civil servants and a crackdown on tax avoidance, it's expected to get the Italian government deficit to below 3% of GDP by 2012.

Gold's peak at 11:00 was at above $1,166; afterwards, the metal slumped back but bottomed at $1,162. As of 11:55 AM, the spot price was $1,163.00 for a loss of $0.30 on the day. The Kitco Gold Index attributed -$6.40 to predominant selling and +$6.10 to a weakening greenback.

The U.S. Dollar Index, after touching 81.5 as of 9:38 AM, underwent a rolling and hesitant rally that got it well above 81.7. As of 11:57, it was at 81.71.

So far, gold's held fairly steady. The storm has passed, but there's no real excitement in the market as of yet. Based upon today's signs, gold will likely continue churning in the afternoon.


Update: Instead of churning, gold climbed upwards in the last forty-five minutes of the pit session. The churning did continue a little after noon ET, but the metal didn't go back downwards after the last churn. Instead, it stayed between $1,163 and $1,164. Starting from the former level as of 12:45, the metal climbed above the latter level around 1:00 and continued upwards with only a little pullback. As of the end of the pit session, or 1:30 PM, the spot price was $1,168.50 for a gain of $5.20 on the day. The Kitco Gold Index assigned -$2.80's worth of change to predominant selling and +$8.00's worth to a weakening greenback.

The U.S. Dollar Index, after almost reaching 81.75, turned downwards and meandered down to a little below 81.55. The second leg of the downturn roughly coincided with gold's run. As of 1:35, the Index was at 81.57.

A little before the run, at around 12:30, St. Louis Federal Reserve president James Bullard said the best way to prevent a Japan-style deflation is for the Fed to buy more Treasury securities; merely holding the Fed Funds rate at near-zero might even be counterproductive. That support for more quantitative easing did have its influence on gold, and may have more later this afternoon.


Update 2: The run-up basically ended after the pit session did, with a double top at $1,169 right after 1:30 PM ET. From there, gold descended to a little below $1,166 before rebounding to around $1,168. From 2:40 to just before 5:15, the metal stayed within the confines of $1,167 and $1,168.50 only to drop below just before the close. At the end of regular trading, the spot price was $1,166.50 for a gain of $3.20 on the day. The Kitco Gold Index attributed -$4.30 to the predominant-selling category and +$7.50 to the weakening-greenback one. Both categories sum up to the raw change on the day.

The U.S. Dollar Index didn't move all that much over the rest of the session. Staying between 81.535 and 81.69, its overall direction was slightly upwards. As of 5:30 PM ET, it was at 81.62.

Its daily chart, from Stockcharts.com, shows a substantial decline from yesterday's mark-time level:


Yesterday, I thought a base was being built for the Index; today's drop makes me look premature, if not wrong. The main reason for the latest drop in the Index was the Euro making it above US$1.30; the chart shows a fairly clear sky for it with respect to the greenback.

The Index's RSI level is again back under the 30 oversold level. Ever since the plummet of July 5th, it hasn't been much above 40 and way below the 50 neutral level. Those levels are not characteristic of a bull market; they're more characteristic of a bear market. The last comparable RSI dry spell took place in May of 2009, as this 2-year chart shows:


If the Index follows the same track, it's got a long way to fall. However, the last RSI dearth was followed by a partial rebound and a month of stabilization. This one, should it occur, will bottom at a significantly higher level than the one in May of '09. From the long-term perspective the Index may be in a wide trading range between 89-90 and 74, or a huge gently ascending triangle. The U.S. Treasury is really caught between a rock and a hard place with respect to the U.S. dollar: a falling greenback makes for higher exports ceteris paribus, which would help spur the GDP numbers, but a rising greenback makes for currency profits enjoyed by foreign holders of U.S. Treasury securities; those gains make up for the low yield. I suggest gently that the institutional self-interest of the Treasury is more aligned with a rising greenback than with a falling one. I further suggest that the U.S.-as-Japan scenario is also in Treasury's interest because it implies the U.S. T-bond bull market will continue, thus lowering rates. Both developments prevent the more explosive U.S.-as-Greece scenario from erupting - and long-term debtors tend to develop a certain cunning. That debt inurement, plus the long-noted incentive on the part of the U.S. government to minimize reported inflation because doing so minimizes COLA-based entitlement spending increases, means the edge is tilted to gold when it comes to figuring out what's really going on with actual inflation. The bond market moves to the CPI, while the gold market tends to move with this series.

Speaking of gold, its own daily chart shows a continued recovery from Tuesday's plummet:


The technical picture for gold is still lousy, backing up the thesis that bargain-hunting is keeping it from declining further. The spills haven't been as sudden as the one in late-mid May, but yesterday's interday low was below that of May 21st's. The recovery over the two post-plummet days hasn't been as strong.

There's a chance for another one before the summer is through. If there isn't, then this summer's decline from peak to bottom will still be below average for the period. July is almost over, and August tends to see a pick-up. Ther may not be this summer, but the odds say it's likely.

A post-pit Reuters report said the gains were prompted by the above-mentioned Bullard speech, but large outflows from the SPDR Gold Shares Trust limited those gains. Amongst the points therein, these were included:
* Gold boosted on comments that the United States could fall into a Japan-style quagmire of falling prices and investment that is hard to get out of by St. Louis Fed president James Bullard.

* A sharp drop of bullion holdings in the world's biggest gold-backed exchange traded fund combined with a loss of COMEX open interest indicated investors are moving out of the precious metal into other assets such as the equity markets.

* Trading volume of U.S. COMEX gold futures also rose to an all-time high on Wednesday, driven by a combination of an option expiration and contract rollover.

July is almost over, and gold's performance in August is the big question mark. If the metal continues to follow seasonal patterns, there will be a pick-up next month. If a pick-up doesn't come by Labour Day, then the talk about a new financial crisis may have substance to it.

More Buying-Opportunity Counsel

Gary Tanashian has an interesting take on the conspiracy crowd: he says it's a reflection of impatience and a casino mentality that's more at home in the stock market.
There is an opportunity to own value shaping up. I suspect the usual casino players will fail to capitalize while the minority capitalizes once again. Missed the last buying opportunity this space identified in euros? Well, another opportunity is on the way. Who will capitalize and who will be immobilized by fear? Gold in USD is also presenting an opportunity. In fact, name me a major developed society that is not tramping out its currency for the purpose of manufacturing politically expedient economic growth and I will show you a society of relative value from an investment standpoint. There are those in ascension and it is no coincidence that those are targets for my investment dollars in the big picture.

For now, gold is a monetary value anchor. In a world of eroding confidence in politicians and policy makers who use official paper and digital money, gold represents value; nothing more, nothing less. Still, it is always great to exchange confidence paper for value when value goes on sale. You do not buy gold when everybody loves it. You understand who you are and if you perceive that your personal situation is in need of this value anchor, you buy gold when the public hates it. You buy it when the speculators (ultimate casino patrons) are dumping and you-know-who is buying or buying to cover.
He holds up October 2008 as a classic time to buy, and says gold going into a serious intermediate-term decline would lead to another opportunity.

Gold Discountign Another Financial Crisis?

The current weakness in gold is telling to Simon Derrick, head of currency research at Mellon Bank. He sees a parallel between the recent record high of $1,260 and the topping of $1,030 back in February of '08.
He believes it is telling that with the exception of June 21st, the day that China changed its currency policy, falls in the price of gold have come after the publication of uninspiring US economic data.

"The current decline in the price is down to deterioration in sentiment about the economic outlook (and the threat of rising deflationary pressures) rather than a reflection of greater optimism about the standing of the euro," Derrick wrote.

Demand for gold from India fell by 30 percent last year and could fall by as much as 40 percent next year if the Bombay Bullion Association is to be believed, Derrick said.

"All this comes at a time when the technical picture for gold is sending some very clear warning signals. Most notably, a series of lower highs on our favored momentum indicator since the fourth quarter of last year speaks of a longer term trend that is looking increasingly tired," he added.

With the oil price flashing a similar warning, it seems we are getting closer to answering the question whether this feels more like the summer of 2008 or that of 2007. On the basis of the current evidence it seems like July of 2008 provides a better fit," Derrick wrote.
It's an interesting argument, perhaps because it implies there'll be a huge buying opportunity in the fall or winter. The trouble with it is, gold's decline from its February high was (in retrospect suspiciously) out of season. The recent high and current decline are in season.

Besides, the only visible fault line is underneath European sovereign debt. Unlike in the '08 credit crisis, gold benefitted from the Eurocrisis. The only way that a next round could hurt gold would be if the banks' capital levels implode in a deflationary spiral.

Marc Faber Still Bullish On Gold, Bearish On Treasury Securities

As passed along by the Chicago Tribune's Gail MarksJarvis:
Investors, who think they are safe hiding in bonds, are playing with fire, The Gloom, Boom and Doom Report publisher Marc Faber warned in Chicago.

"When the turn comes and inflation and rates rise, all the money in bonds will move into equities," he told analysts and money managers from throughout the world at the CFA Institute's summer seminar....

In 2007, Faber was warning investors to avoid stocks as he observed the growing threat of a financial meltdown. Now, he says the cure for the meltdown is a threat to bonds, which would plunge in value if rates and inflation rise -- as he says they ultimately will.

"At some point people won't want to be compensated at two percent" in bonds, and will put money into stocks, he said. "Government bonds will not be a good investment for the next 10 years."
Faber also likes Asian stocks and those of "developing frontier economies," but he keeps returning to the themes of physical gold and agricultural land.

Gauge Of Inflation / Safe Haven Components For Gold

Gold sometimes rises becasue of inflation fears, and sometimes out of fears for the financial system. Steve Place concludes that gold was not pushed up by inflation demand after checking the correlation between GLD and a multi-commodity ETF (DBC). While gold was going up late last spring, the correlation between the two dropped to only slightly positive - or near-zero.
This is a correlation between two etfs: GLD and DBC.... DBC is a commodity etf that has exposure in heating oil, crude, gold, natty, zinc, and others. Basically, when GLD and DBC are highly correlated, that means there is more risk of inflation, and when the correlation breaks down, it means we are in a “risk aversion” mode.

This can actually make for a nice long term timing of the market, and we’re coming down to levels in which I feel the risk for reflation could be coming back into play (maybe). A confirmation would be a drop in demand for treasuries.

It's an interesting tool, as it's sometimes hard to see whether financial-crisis demand is tied to expectations of future inflation or not.

Indian Gold Buying Still Active

According to a report by the Economic Times, buyers are still coming in to stock up for festival season at low prices; that buying pressure pushed up premiums for gold bars.
"We got good order fills at $1,159/1,160 (an ounce) yesterday, and the current levels are still attractive for local buyers," said a dealer with a private bank in Mumbai, which deals in bullion....

"We have plenty of advanced orders in the range of $1,150-1,157," said another dealer with a state-run bank. Premiums have moved up to $1.5 an ounce from 80 cents-$1 per ounce a few days earlier on a surge in demand from India, dealers said.
There has been some downward price acclimatization, as the present bid range is lower than it was; the knocked-out bids at $1,160-$1,175 have not been replaced. But, the rise in premiums does show an active market.

Peter Brimelow Says Rising Bearishness, Except Fro The Usual Suspects

As Brimelow relates, a lot of market times have turned the frown on gold.
Most observers are very negative. At JSMineset, "Trader Dan" Norcini gloomily noted on Tuesday evening: "Technically, the market fell out of its trading range that has been in place since May. ... Bears have now gained control over the market"

The Aden Report declared in its weekly update Wednesday evening: "The gold price fell to a three-month low yesterday in both dollars and the euro. ... It's clearly in a D decline, and it's weak by staying below $1,200, basis December. If gold now stays below $1,180, it's very weak and it could test the $1,135 level. In a worst case, it could test its rising 65-week moving average, now at $1,080."...

MarketVane's Bullish Consensus is back down to 61% Bulls. On July 19 it fell to 60% (and gold then staged a modest rally). Lower readings were last seen at the height of the crisis in December 2008. The Hulbert Gold Newsletter Sentiment Index is at 9.2%, which is its low for the year.
However, the habituants of Le Metropole Café are still bullish - some insistently so - on confidence that physical demand will keep the market from sliding further.

Poking Around For Likely Takeovers

A Morningstar report says takeovers are going to continue in the gold-mining sector, and it tries to identify some. Since the report left out gold juniors, the universe of small- and mid-tier producers it works with is fairly small.

According to its author, Joung Park, there are three factors motivating a takeover as based upon recent ones: the potential target has to have sizable amounts of low-cost reserves, near the potential acquirer's own properties, and there already has to be a joint-venture or minority-stake relationship between the latter and the former. Based upon these criteria, the only takeover candidate Park fleshed out is Kinross Gold; that company is a potential target for Barrick. Two other candidates are mentioned, but the would-be acquiers would be more likely to buy a property instead of the whole company in those cases.

Gold Inches Up Overnight But Falls Back

Despite a slight dip shortly after the beginning of overnight trading, gold managed to inch above $1,165 and briefly touch $1,170. The height of the overnight was made around 3 AM ET, when the price touched $1,170.40. Pulling back, the metal still stayed above $1,165 until about 7:30 AM when it dipped to $1,161.80 before rebounding a little. As of 8:05 AM ET, the spot price was $1,163.50 for a gain of $0.20 on the day. The Kitco Gold Index attributed -$6.50 to predominant selling and +$6.70 to weakening of the greenback.

The U.S. Dollar Index spent some of last night drifting, but it began falling around 9:15 PM. Tumbling a bit after breaking through 81.95, its fall climaxed at just above 81.5 before it double-bottomed and started pulling up at 7:20 AM. As of 8:12, it was at 81.65.

A Wall Street Journal report said gold crept higher because of bargain hunting induced by a steadier market.
"It looks like the selling has eased off a bit," said Afshin Nabavi, head of trading at Swiss trading house MKS Finance. "I don't know if it's finished or if it's just waiting for time."

Demand for physical gold has absorbed a lot of selling pressure, and there are sufficient bids in the market to hold gold above $1,160 in the near-term, he said.
The article also mentions a large drop in the holdings of the SPDR Gold Shares Trust, by 18.55 tonnes to 1,282.38 tonnes.

An earlier Reuters report ascribed last night's rise to physical buyers stepping in as well as bargain hunting.
"Signs of slowdown in the U.S. recovery (yesterday) sent out ripples again, so we've seen bargain hunters coming in given there's still a long way to go in terms of economic recovery," said TheBullionDesk.com analyst James Moore.

He added: "There's been good demand from physical sector this morning (but) over next week or two my outlook is for sideways to lower trade. We saw 18 tonnes of gold cut from the SPDR gold trust yesterday."
The article also noted that, despite the price relief for jewelers which many were happy to take advantage of, negative sentiment still weighed on the market.

The weekly jobless-claim numbers came in; the initial-claims number of 457,000 was slightly lower than expected. Although continuing claims rose, the four-week moving average of initial claims fell. After sinking to around $1,160, gold blipped up just beforehand but fell right after the data was released in a short-lived downward spike that made a new daily low of $1,159.10. As of 8:54 AM, the spot price was $1,162.20 for a drop of $1.10 on the day. The Kitco Gold Index assigned -$7.90's worth of change to predominant selling and +$6.80's worth to greenback weakness. The U.S. Dollar Index managed to climb up to almost 81.75 but began dropping at 8:36. As of 8:57, it was at 81.61.

Again, the pit session started off less than encouragingly. Still, gold's floor of $1,160 has remained solid if occasionally flexible. The rest of the pit session may see the metal holding steady.

Wednesday, July 28, 2010

Gold, After Further Slump, Steadies

After regular trading began, gold fell below $1,160 because of bad news on the U.S. durable-goods orders front. A drop of 1% in June was well below expectations for a 1% rise. Subsequent to that report, the metal trended down but choppily; the day's low of $1,156.90 was made around 9:45 AM ET. After double-bottoming, though, gold began rising just after 10:00; its climb got the metal up to $1,164 by 10:45. Falling back, it halted that next decline at $1,159. Overall, gold is fluctuating around its $1,160 support level. As of 11:55, the spot price was $1,161.10 for a loss of $0.50 on the day. The Kitco Gold Index attributed -$1.10 to predominant selling and +$0.60 to a weakening greenback.

The U.S. Dollar Index has been fairly steady in a range bordered by 81.95 on the downside and 82.2 on the upside. Reaching its morning nadir around 10:45, it drifted back up while remaining in that interday range. As of 11:56, it was at 82.10.

Although more bad U.S. economic news rocked gold this morning, it didn't have the same effect that yesterday's consumer confidence report did. The metal holding steady after being knocked yesterday shows the air pockets are now gone from the gold market. The rest of the pit session should show more drift.


Update: There was more drift. After bouncing around a zone between $1,159 and $1,161, the metal snuck up a little but not above $1,163. Peaking just after 1:00 PM ET, the metal continued bouncing but with an overall downward bias until it bottomed at $1,159 again. As of the end of the pit session, or 1:30, the spot price was $1,161.50 for a drop of $0.10 on the day. The Kitco Gold Index assigned -$0.15's worth of change to predominant selling and +$0.05's worth to overall greenback weakness.

The U.S. Dollar Index, after surmounting 82.1, drifted around that level until it blipped up slightly starting at 1:20. As of 1:35, it was at 82.135.

In advance of the release of the Fed's Beige Book, there isn't much discounting one way or another. Yesterday's tumble seems to have left the gold market exhausted today. Unless the Beige Book contains some surprises, the drift will likely continue until the close.


Update 2: The Beige Book came out at 2 PM ET, and it showed a less rosy picture than the last one. The economy improved overall, but the pace slowed and two districts reported backsliding. It had little effect on gold, which continued bouncing around but moved up slightly overall. By the time 4 PM came around, the bouncing had largely stopped and gold was left around $1,163. As of the close, the spot price was $1,163.30 for a gain of $1.70 on the day. The Kitco Gold Index split the gain into +$1.30 due to predominant buying and +$0.40 due to overall weakening of the greenback.

The U.S. Dollar Index headed up unsteadily until 3:20, when it managed to reach above 82.2. Falling back to almost 82.05, it double bottomed and then trundled upwards. As of 5:30, it was at 82.125.

Its daily charts, from Stockcharts.com, shows the Index basically staying in place:


Today's movement wasn't much all told, and the close was quite close to the open. The Index is still near oversold levels, and for now it's stalled just above 82.

Unlike the last two short-term lows, this one han't seen a real rebound afterwards. Yesterday's interday low was only a little below the last one made twelve days ago, which suggests a slowing of the Index's decline. There's no sign of an upturn with any real strength, but it could be argued that the Index is basing at this point.

As for gold, its own daily chart shows a mild recovery today:


Although today's interday low was slightly below yesterday's, the plummet was still halted in its tracks. The durable-good report at 8:30 did provoke another downturn, but it was much more limited in extent than yesterday's. It also was erased by a recovery. There's no way for me to time the gold market, but today's pattern is reminiscent of the day after Feb. 4th's wipeout. I'm also seeing more bearish calls from people who aren't inclined to be gold permabears.

Is gold basing? There's an argument to be made that it is. Gold has been affected by the ill winds now blowing, where good news is interpreted badly and bad news is held to be symptomatic of deflation. There's also the aftereffect of the Eurocrisis, which has led to disappointment from the formerly enthusiastic. The mood has swung the other way; it was only a couple of months ago when good news was good for gold and so was bad.

With enthusiasm turned into gloom, there's a case to be made that gold is now below where it should be - and some are making it. Most of the ones I've seen have an entry point well below today's close, like this fellow; this one's an exception. How it turns out, we'll see over the rest of the summer.

A post-pit Wall Street Journal report notes that gold not only held steady because of bargain hunting but also because of lack of investor interest.
"Gold was the hot thing all spring and early summer," said Bob Haberkorn, senior market strategist with Lind-Waldock in Chicago. "Now it's like the stepchild."

The metal hasn't been helped much by a weakening U.S. dollar--which often lifts dollar-denominated gold by making it less expensive for buyers using other currencies--as equities have been ascendant while a measure of calm has returned to markets.

"People are more inclined to put their risk into equities," Haberkorn said. "It's kind of left gold by the wayside."

Be that so, but the pendulum has swung the other way. Gold may continue in its doldrums, but there isn't that much excitement to dampen anymore. To move down significantly from here would require something close to outright panic.

Jeb Handwerger Sees Support For Gold At These Levels

Unlike this Barclays techncial analyst, Jeb Handwerger sees gold as still in a rising channel that provides support at these levels. Consequently, he thinks gold is in buying-opportunity mode right now.
Gold is now at my buy point of the rising long term trend support line (click on chart...). GLD touched that line 6 times, which signifies that this trendline is a reliable point of support. The significance of this line is that it is not steep, which also brings a higher probability that GLD will find support here. It is also oversold. Continued weakness here and a break below this long term trend would be troubling and highly unlikely. If there is a break most likely it would be exhaustive, meaning that it will shake out a lot of shares before the next move higher. I do not see $1200 as a top in gold as there are no technical signs of a major top.
He also sagely notes that the best time to buy usually makes the buyer uncomfortable. To extend his winter-coat-in-summer analogy, it can be awkward sporting a winter coat around in the heat.

Another Gold-Watcher Says Buying Opportunity Coming

Dominic Frisby points out that times like these are shake-out times for those who are trend-chasers or who don't really believe in gold. Generally, summer is a good time to buy gold; the only exception came due to the financial crisis, but the metal recovered to its summer levels and above by the end of the year.

He uses the 252-day moving average as a touchstone. Right not, it's at $1,110; that level, he recommends, would be a real buying opportunity for the metal.
To conclude - we know that the July-August timeframe has been a good time to buy gold in recent years. Given that in the coming weeks gold looks likely to touch, or come close to touching, its 252-day moving [average], which have proved such a consistent marker over the last ten years, I'd suggest that if gold falls another $50 or so from here, that could well mark an excellent buying opportunity for those who don't currently have, or those who want to add to, a position in gold. (And, by the way, somewhere just beneath the blue line might mark a sensible place for a stop).

Of course, it's possible that the bull market is over. I don't think it is, but that doesn't mean I'm right. I see $1,040 - the old high - as a big number for gold. If it falls beneath that, then we need to have a serious rethink.

There is that risk, and he is cognizant of it; he's no superbull.

Indian Gold Buying Picks Up After Plummet

According to a report by the Economic Times, lower prices have spurred Indian gold buying.
"Buying is definitely there.... Traders, who bought 10 kgs a few days back, are now buying 40 kgs," said Harshad Ajmera, proprietor, of Kolkata-based JJ Gold House...

"There could be more buying if prices fall to about $1,150 (an ounce)," said dealer with a state-run bank in Mumbai.
Also aiding the buying spree was a strengthening rupee, although the direction of Indian stocks didn't lend much confidence to a bullish outlook for gold.

Indian Gold Imports For July Halve

According to a Reuters India report, Indian gold imports for this month are slated to come in at about half of what they were for July of '09.
"It is all because of the prices," [head of Bombay Bullion Association Suresh] Hundia told Reuters, referring to the firm levels gold has held on for the greater part of the month in the local market.

In the international market gold prices went into a gradual decline in July after hitting highs in the previous month as buyers weighed its investment appeal amid a sputtering global economic recovery.

Though prices were softer in July from the month ago, Indians were still not used to the levels, Hundia said.
The estimate for this month is 14-15 tonnes. July of '09's figure was 28.4 tonnes.

Nassim Nicholas Taleb Says Government Debt Next Black Swan

In an interview with Business Week timed with a release of a new edition of his book, Taleb says government deficits and debt are going to be the source of the next Black Swan.
What are are potential sources of fragility or danger that you're keeping an eye on?

The massive one is government deficits. As an analogy: You often have planes landing two hours late. In some cases, when you have volcanos, you can land two or three weeks late. How often have you landed two hours early? Never. It's the same with deficits. The errors tend to go one way rather than the other. When I wrote The Black Swan, I realized there was a huge bias in the way people estimate deficits and make forecasts. Typically things costs more, which is chronic. Governments that try to shoot for a surplus hardly ever reach it.

The problem is getting runaway. It's becoming a pure Ponzi scheme. It's very nonlinear: You need more and more debt just to stay where you are. And what broke [convicted financier Bernard] Madoff is going to break governments. They need to find new suckers all the time. And unfortunately the world has run out of suckers.
He says that a U.S. sovereign debt crisis will be a Black Swan to those not forewarned. So, his own warning could be seen as an attempt to forestall it. He also said the world has become too financialized, with too little attention paid to ordinary sources of income. A sound financial plan for (say) retirement should be focused on capital preservation.

Barclays Technical Analyst Says $1,127 Gold Possible

The reason given by the analyst is gold falling below a trendline that has held up for 21 months. The specific target was reached by Fibonacci analysis, using a 23.6% retracement from gold's October '08 low.
“The trend-line break is forcing a lot of people out of their positions,” MacNeil Curry, an analyst at Barclays, said in an interview from New York. “People being washed out of their positions may open up an opportunity for a stronger base and subsequent move higher.”

Technical analysts tend to be trend-followers; as a result, their predictions often are bankable in terms of footage. This prediction plays into the current cloud over the metal; a contrarian may doubt as a result.

Gold Stays Steady After Yesterday's Tumble

After being hammered down to $1,160, gold stayed in a range between that level and $1,165. Last night saw a drift upwards, which came to a halt as night turned into morning. A dip at 1:30 AM ET led to a daily low of $1,160.70, after which the metal recovered and moved close to $1,165 in the next two hours. The daily high of $1,167.00 was made at around 5:00, but above-$1,165 didn't last; the metal descended to the middle of the range afterwards before pulling up again. As of 8:09 AM ET, the spot price was $1,163.40 for a gain of $1.80 on the day. The Kitco Gold Index split the gain into +$1.40 for predominant buying and +$0.40 for weakening of the greenback.

The U.S. Dollar Index, after inching up to 82.3 last evening, descended to a little below 82 by 3:10 AM. Subsequently, it bobbed with decreasing volatility as it veered in around the 82.1 level. As of 8:14, it was at 82.12.

A Wall Street Journal article said gold was steadied by physical buying.
"There's some very good physical demand here," said a senior trader in London.

But physical buying may not be strong enough to overcome investors' dwindling lack of appetite for gold, analysts said. A recovery in confidence across equity markets and the euro's stronger outlook have negated two key factors that had underpinned gold's rally to a record high of $1,249.40 on May 14.

"People seem to be a little bit more confident about matters economic and are taking on risk again," said the trader in London.
The article also said the short sellers have come back in force.

An earlier Reuters article said part of the reason why gold has been declining has been deflationary pressures, or lack of inflationary pressures.
With increasing market scrutiny on nations' fiscal health and doubts over the effectiveness of ultra-low monetary policies in supporting the economy, governments around the world are facing difficulties finding fresh ways to stimulate the economy and beat deflationary pressures, said Koichiro Kamei, managing director at Tokyo-based researcher Market Strategy Institute Inc....

"Reasons supporting investor buying of gold have weakened recently, and options-related technical selling could undermine sentiment in the short-term as investors seek fresh clues for direction," Kamei said.
The article also mentions holdings of the SPDR Gold Shares Trust dropped yesterday to 1,300.83 tonnes.

The stabilization didn't hold up with the beginning of regular trading. After a recovery from a descent to $1,161, gold fell to a new daily low of $1,158.50 on the heels of a durable-good report saying orders dropped by 1%. Expectations were for a 1% rise. As of 8:57, the spot price was $1,159.90 for a drop of $1.70 on the day. The Kitco Gold Index attributed -$2.30 to predominant selling and +$0.60 to greenback weakness. The U.S. Dollar Index continued fluctuating and made no lasting gain or loss from the report. As of 8:59, it was at 82.12.

Bad news has once again become bad news for gold as the deflationist meme recovers. The metal may recover today, but the start of the pit session hasn't been that inspiring.

Tuesday, July 27, 2010

Gold Tumbles To $1,160

After a combination of good and bad U.S. economic news, gold tumbled well below the floor of its current range. The decline started slowly around 8:40 AM ET; by the time the Case-Shiller Housing Index number was released, showing a 1.3% seasonally-unadjusted increase in home prices in the twenty cities surveyed, gold was at $1,182. The tumble began at the same time the data were released, or 9 AM. An hour later, the metal was at $1,170. Then, the Conference Board's consumer-confidence numbers were released. The overall index value was 50.4, a big drop from last month's revised 54.3.

The metal's fall continued after this item was disseminated. A fifteen-minute relief rally between 10:15 and 10:30 failed to get the price above $1,170, and the metal ended its tumble at a new daily low of $1,159.70. Since that low, made at about 10:45, gold was drifting around the $1,162 level before blipping down a bit. As of 11:53 AM, the spot price was $1,160.70 for a loss of $21.40 on the day. The Kitco Gold Index split the loss into -$18.30 for predominant selling and -$3.10 for a strengthening greenback.

Exacerbating gold's losses was an upturn in the U.S. Dollar Index to well above 82. Although the extent of the rally wasn't large - it got no higher than 82.375 - the direction was clear. From around 81.9 at the time gold's tumble began, the Index climbed intermittently but steadily in morning trading until it hit that peak at 11:21. As of 11:56, it was at 82.24.

I admit to beign surprised by the tumble, which has taken gold down a fair bit today. It's possible that physical buying will be deterred by hopes of a further drop. Still, solid support exists at $1,160 which is still holding up.


Update: That support level gave way just before 1:00 PM ET, after a dip below it just after noon. Shortly after 1:00, the metal made a new daily low of $1,156.80. That foundering was enough to keep it from reaching $1,160 by the end of the pit session. As of that time, or 1:30, the spot price was $1,158.40 for a drop of $23.70 on the day. The Kitco Gold Index divided the loss into -$19.75 for predominant selling and -$3.95 for strength in the greenback.

The U.S. Dollar Index, after hovering around 82.25, fell to 82.1 between 12:10 and 12:20. The Index subsequently recovered, and managed to surmount 82.25 just before 1:30. As of that time, it reached 82.31.

Gold's tumble did lead to an aftershock, which the $1,160 level failed to halt. There may be further drops later this afternoon, but they're likely to be limited in extent.


Update 2: As it turned out, the $1,160 support level was restored in later-afternoon trading. The rebound took place shortly after the end of the pit session. After which, the metal hovered around $1,160; except for a mid-afternoon stretch, it slowly inched up. As of the end of regular trading, the spot price was $1,161.60 for a drop of $20.50. The Kitco Gold Index apportioned -$18.70 to the predominant-selling category and -$1.80 to the strengtening-greenback one.

The U.S. Dollar Index pulled back a little in later afternoon but stayed well above 82. Sliding down to 82.1 by 4:20 PM ET, the Index then pulled up and settled around 82.15. As of 5:30, the Index was at 82.145.

Its daily chart, from Stockcharts.com, shows a slight recovery overall:


Despite that recovery, the fall continues. 82 did hold at the end of the day, but it was unsuccessfully challenged. Today's interday low made for a new one not seen since May 4th. The Index's RSI level (found at the bottom of its chart) continues to droop at near-oversold levels, suggesting the momentum in late spring is long gone.

However, there's a slight divergence. Today's RSI level is a little bit higher than the one at the last near-term high, while today's Index low is lower. The MACD lines, found at the bottom of the chart, are still in a bearish configuration but are close to crossing over into a bullish one. Given the Index's performance since early June, such a crossover isn't likely to portend much more than a more extended upward reaction. Still, the courrent drop can't go on forever.

As for gold, its plummet today shows quite prominently on its own daily chart:


The old $1,175 support level gave way, even though $1,160 ended up holding. Gold's own RSI level is fairly close to oversold levels, and its own MACD lines are still solidly in a bearish configuration.

There's a chance for a further fall if this day's tumble resembles late May's. The physical buyers waiting for the chance to buy below $1,175 will have their chance, but they may pull their bids in the hope of more declines. So far, I've seen no missives pegging the current rout as a buying opportunity.

If the behaviour after this plummet is like that after the last one, the metal will muddle along just above $1,160 with a ceiling around $1,175-$1,180. Whatever the outcome, the seasonal summer weakness is still afflicting gold.

A post-pit Reuters report pegs the decline as caused by technical selling triggered by the above-mentioned housing and consumer-confidence data plus options expiry. Amongst other points therein, these were included:
* After trading modestly weaker in early sessions, bullion prices accelerated losses despite firm U.S. stock markets and a flat dollar.

* Gold pressured as crude oil leads commodities to decline on weak consumer sentiment.

* Selling related to COMEX August option expiration and first-notice day on Friday trigger heavy selling in gold futures - Sean Lusk at futures broker PFGBest.

* Bullion prices are at risk of breaking below a two-year bullish support channel and could fall toward $1,000 an ounce, CitiFX said.
That could happen if the physical-buying rug is pulled out and stays furled, but it seems unlikely. Today was a bad day for gold, one I didn't expect, but it's not the first time such plummets have visited the market. The long-term bull market is still intact.

Walter de Wet Says Gold Looks Techncially Bearish

In the midst of a short analysis of the gold market, Standard Bank analyst Walter de Wet says gold looks technically weak:
In technical terms, gold looks bearish within a $1,181 - $1,174 range where the 100-day MA and long-term support trendlines meet. However, in the physical market, buying interest is providing support around this crucial technical range for gold. A break below this range could see gold decline to $1,150.
It's hard to criticize his timing. This morning, the metal tumbled down to $1,160 as the previous range bottom broke through.

Fall Run To $1,300?

Despite gold's present doldrums, an options advisor at www.skoptionstrading.com says the metal looks positioned to mount an assualt at $1,300 starting in a month or so. Despite that call, (s)he says it's too early to buy out-of-the-money call options on gold. Leaving open the possibility that it will fall to around $1,140, the advisor suggests selling out-of-the-money puts on the metal for now. August puts below $1,140 are being considered. Then, in late August, the next trade should be buying out-of-the-money calls, with strike price of $1,250 or higher, expiring in January '11 or later.


This strategy depends upon gold's seasonal weakness turning into a strong rally in the fall. The first half of it, selling those puts, seems the less risky play.

James Altucher's Favourite Gold Stock

Yes, he has one. Despite his aversion to gold as an investment, he likes Kingold because he thinks it has a lock on the mainland Chinese jewelry market although it's present market share is only 4.3% by his calculation. The company sells gold jewelry, and has its supply chain management fine-tuned to the point where there's an average of five days between buying the raw gold and selling the jewelry. According to Alucher, who believes in gold as a luxury good, the Chinese jewelry market is growing strong.
One of the biggest demographic trends that will be occurring over the next ten years is the rising middle class in China. The China middle class is growing by approximately 50mm people a year and represents 25% of the population now, up from less than 5% of the population a decade ago. That means, for instance, that China has gone from being the 20th country ranked by oil consumption to the 2nd country and is now number one in terms of total energy consumption. It also means the demand for luxuries by this nouveau middle class is now insatiable, growing, and cannot easily be satisfied due to lack of supply....
Altucher lists seven points in Kingold's favour, including growth of the market as well as growth of the company itself. Three of them involve strong revenue growth, strong earnings growth and a low forward P/E ratio. The company's trailing P/E is about 18 right now.

Gold Hand-Down Favourite At Agora Conference

According to Peter Cooper, the consensus at an Agora Financial symposium has a fairly good track record. 2008's saw a consensus against stocks before the financial crisis erupted.

This year, the consensus is for gold. In a nutshell, the argument says we're in a re-run of the mid 1970s; inflation will come roaring back in a few years.
The re-run of the mid to late 70s school of thought is right. We have had the financial accidents of 1973 and 74, and the gold correction of 75. We are perhaps in mid-76, another very hot summer or was that 75?

The policy response to the financial crashes has not been so different this time. It took time in the 70s too for inflation to gather speed, and we saw a big deflation of house prices in 74-75. It is no different this time.

However, by 1977-8 inflation was picking up speed and it topped out in 1980 with gold at $800 an ounce – eight times higher than its correction in 1975. Adjusted for inflation then that would put gold at $5,000 an ounce by 2013.

We have not even seen the start of the ballistic up phase for gold. The past 10 years is only base-building for the rise to come.

Gold bug Jim Sinclair has $1,650 by next February and this forecast looks perfectly possible after the usual summer down for the gold price. Remember when he made that prediction the gold price was nearer $400 and then it looked outrageous....

The "new '70s" thesis is fairly credible if John Williams' alternate measure of inflation is used. At the very least, because his inflation-calculation methodology is the same as that used by official sources in the 1970s, it's the best metric for comparing this decade to the 1970s.

Indian Gold Buying Still Soft

According to a report by the Economic Times, gold buying remained subdued as traders still await lower prices.
"There are a few deals in between $1,180-1,185 (an ounce), but in all weak as it was yesterday," said a dealer with a state-run bank in Mumbai, which deals in bullion....

"Traders are waiting for a breakout on either side of $1,180-1,200, where I have advanced buy orders," said another dealer with a state-run bullion dealing bank.
The article also notes the rupee's strengthening, which has helped sentiment somewhat.

Case/Shiller Index Rises 1.3% In May; Gold Tumbles

Although there are cautions not to read too much into the data, the Case-Shiller housing price index rose 1.3% in May (not seasonally adjusted) for the second monthly rise in a row. Price rose in 19 out of 20 cities surveyed.


Right around the time the news was released (at 9 AM ET) gold started dropping in earnest, adding to a milder decline that started a half an hour earlier. An hour afterwards, the metal had gone from $1,182 to $1,170.

Gold Drifts Up Slightly

There was little overnight news pertaining to gold, and little action in the metal itself overnight. Gold drifted up to $1,185 last night, and stayed around that level until 3:30 AM ET. A blip up to $1,188.40 turned into a fall, which brought the metal down to its daily low of $1,181.70 reached at a little before 7:00. A reversal of that fall brought gold back to around $1,185. As of 8:00 AM ET, the spot price was $1,185.10 for a gain of $3.00 on the day. The Kitco Gold Index split the gain into +$0.50 due to predominant buying and +$2.50 due to weakening of the greenback.

The U.S. Dollar Index, after moving up slightly last evening, dropped slightly below 82 later. Recovering somewhat, it then fluctuated around the 82 level until a more sustained rally kicked in around 3:15 AM. Making it to 82.25 by 5:30, the Index then reversed course and fell back down below 82 again for a new overnight low. As of 8:09, it was at 81.86.

A Wall Street Journal report said physical demand is offsetting reduced investor demand, keeping gold in a tight range.
"It seems people are moving a bit out of gold," said Jeremy East, global head of commodities trading at Standard Chartered in London. "Financial meltdown and all the rest of it seems to be disappearing."...

UBS analyst Edel Tully said gold ETF holdings in July are having their worst month since February. Holdings in gold ETFs are up just 219,000 ounces, well below the average monthly inflows of 2.44 million ounces for March to June, Ms. Tully said in a report Tuesday.

The falloff puts pressure on jewelry demand to make up the slack, and it may not emerge until prices are significantly lower.
The article further quotes East as saying second dips encourage physical buyers to shy away, even though they come in on the first dip.

An earlier Bloomberg report, as webbed by Business Week, says bargain hunters may take heart from the first monthly decline in gold prices since March.
“For the past two or three weeks we’ve seen good buying in the physical market” at current prices, said Walter de Wet, an analyst at Standard Bank Plc in London. Still, “if gold doesn’t move higher, physical buyers will probably adjust their expectations lower.”...

“The regional physical markets are still seeing bargain hunting, which is helping to underpin values,” David Wilson, an analyst at Societe Generale in London, wrote in a report yesterday. “The continued uncertainties in the markets, including the mixed reaction to the results of the European Union stress tests, is expected to sustain investment interest in the market for the medium term and we look for further price gains as the year wears on.”
The article also mentions holdings of the SPDR Gold Shares Trust declined 0.3 tonnes yesterday to 1,301.74 tonnes.

A Reuters report says a lower greenback also helped gold but sentiment is softening.
"There seems to be a pause in the gold market, with investors unclear about the immediate trend," said Pradeep Unni, senior analyst at Richcomm Global Services.

"Investment demand has taken a back seat and physical buying is only expected to emerge by the end of this month.

"There is overall weakness in place and it's likely that gold would be dragged slowly and steadily to $1,170, but weakness beyond $1,165 isn't envisaged," he added....

"Given current market momentum, a net redemption ETF trend could well follow through in August," said UBS analyst Edel Tully in a note. "January holds the title of the worst monthly ETF performance in 2010 with 722,200 ounces of net selling action, February follows (with a drop of) 79,600 ounces.

"If gold retains its current dynamics, then it's quite possible that investors will return to early first-quarter activity," she added.
The article also mentions gold is trading more in line with other commodities.

A dip preceded the opening of the pit session, dragging the metal down to $1,181 before a rebound kicked in. As of 8:52 AM, the spot price was $1,183.20 for a gain of $1.10 on the day. The Kitco Gold Index attributed -$0.40 to predominant selling and +$1.50 to a weakening greenback. The U.S. Dollar Index, after some hestitation, rallied to the 82 level. As of 8:57, it was at 82.01.

The doldrums continue, with gold not making much headway above $1,185. As the day unfolds, the short-term interday range is likely to keep in place.

Monday, July 26, 2010

Gold Gets Knocked Down By Housing Sales Data

After a nice climb up to above $1,192 when regular trading started, gold turned downwards around 9:30 AM ET. Still, it hung around a little below $1,190 until the U.S. June new home sales number was released. Total sales of 330,000 were higher than expected, which catalyzed a drop in the metal all the way down to a little below $1,180. The decline then abated by gold getting back up to $1,182. That relief rebound didn't last: around 11:00, the metal dropped further to below $1,180 again. In that timeframe, a new daily low of $1,178.60 was made. The relief rally that followed was stronger: starting at 11:10, the metal veered up to the mid-1180s. As of 12:02 PM ET, the spot price was $1,185.40 for a loss of $4.30 on the day. The Kitco Gold Index attributed -$10.90 to predominant buying and +$6.60 to weakening of the greenback.

The U.S. Dollar Index wasn't affected by the new-home-sales number. Fluctuating between 82.25 and 82.3 in mid-morning trading, it went on a rally that peaked as of 10:46 at just below 82.4. Then, the rally turned into a downturn that saw the Index reach just below 82.1. As of 12:04 PM, it had turned still lower at 82.06.

The greenback's late-morning drop helped add strength to gold's rally, but there is a hint of the old concurrency returning. A good U.S. economic datum diminished the safe-haven appeal of both. Gold may recover to $1,190, but so far any such recovery looks iffy.


Update: In the rest of the pit session, that recovery did not happen. Instead, gold topped out at a little above $1,186. After sinking back to $1,182 around 12:45 AM ET, the metal pulled up and settled into a zone between $1,186 and $1,184. As of the end of the pit session, or 1:30, the spot price was $1,184.50 for a loss of $5.20 since Friday's close. The Kitco Gold Index assigned -$12.50's worth of change to predominant selling and +$7.30 to greenback weakness.

The U.S. Dollar Index spent early afternoon softening. After reaching 82.0 a little after noon, and pulling up to 82.1 later, the Index sunk a little below 82 but ended up staying at that level. As of 1:35, it was at exactly 82.0.

Gold made it to the mid 1180s, which is an improvement from its lows, but the metal is likely to close with a loss on the day. Good news is still bad news for the metal.


Update 2: The recovery all-but fizzled in the electronic-trading hitch. After descending to slightly below $1,184, the metal dropped down to a little above $1,180 by 2:50. A double bottom preceded a rise up to $1,183, which gave way a litle just before the end. As of the close of regular trading, the spot price was $1,182.10 for a drop of $7.60. The Kitco Gold Index attributed -$14.50 to predominant selling and +$6.90 to weakening of the greenback. The two categories sum up to the raw change since Friday's close.

The U.S. Dollar Index didn't do that much in the rest of the afternoon, but it did get below 82 albeit breifly. For the bulk of the stretch, it fluctuated between that same level and 82.1. As of 5:30, it was at 82.035.

Its daily charts, from Stockcharts.com, shows today's close at slightly lower than recent interday lows:


Today's decline makes for the third session in a row. The Index barely made a new short-term low, although staying above the 82 support level. Its RSI level, found at the top of its chart, is close to oversold levels again.

How low can it go? It's now wellbelow its 50-day moving average but stil well above its 200-day moving average. The former has turned down, but the latter is still trending up. The distance between the two moving averages is indicative of the Index's run in late spring. 82 is a fairly important support level; if the Index gets and stays below it, there could be a fair bit of downide left. 80 wouldn't be out of the question. At any rate, it's clear that the Index's intermediate-term downtrend does no appear finished.

As for gold, its own daily chart shows the inching up over the course of last week came to an end today:


The metal managed to stay above the recent $1,175 support level, keeping the current trading range intact, but the slight upward momentum it showed last week is gone.

Still, the drop hasn't gone that far. The current interday range is only a little below the previous one, and support is still being provided by physical buying. Investment demand may have dried up for now, but that other source is still active. Hence gold's reluctance to fall very far.

There isn't any pressure to push the metal above $1,200 right now, and any that has existed in the recent past has fizzled, but the lower end of the range is still solid. Gold's midsummer holding pattern is still in place.

A post-pit Reuters report ascribes today's drop to safe-haven demand fizzling due to the home-sales number. Amongst the points made therein, these were included:
* Bullion was pressured as U.S. stocks gained ground after data showed sales of new U.S. single-family homes rebounded in June from May's record low.

* Gold was hovering just above an upward trend support, but a sharp price decline could happen in an overly bullish gold futures market held up largely by short-term, speculative investors - analysts.

* Money managers cut their long, or bullish exposure, to U.S. gold futures by 18 percent for the week to July 20 as the metal's prices hit two-month lows, U.S. CFTC's trade data showed. [ID:nN23274411]
Presumably, more good news from the U.S. economy will continue to pressure the metal as there's an absence of countervailing (or overpowering) bullishness right now. With inflation failing to make an appearance in the U.S. and the Eurozone, and it being still relatively muted in the U.K., the next big driver for the metal has not kicked in. Nevertheless, the metal's still holding up at levels well above last mid-winter. The recent doldrums can be taken as a sign that gold's long-term bull market has not tipped over into a frenzy, except briefly at the height of the Eurocrisis.

Gold Nanoparticles Add To Efficiency Of Bacteria-Produced Electricity

It;s not likely to be a significant source of demand, and it's only a lab project right now, but an electrical system using microbes to generate electricity has its efficiency improved about twenty times by putting gold nanocoating on the anode. That efficiency gain is compared to using naked graphite anodes. Since gold is expensive, the inventors are loking for a cheaper alternative like iron.

Planned uses for the gizmo are water treatment and even desalination in the midst of generating power.

Gold Trading As Currency

In a commentary over at EquityMaster.com, Asad Dossani says the reason for gold quintupling in five years has little to do with it as a commodity and lots to do with it as a currency. Despite the gold standard being gone, lots of gold holders still expect it to act as a store of value and gold is priced accordingly.


Dossani makes a good point when he says gold cannot be printed, which keeps its value up, but gold is not supported by any major central bank; the latter fact adds to the metal's potential downward volaility.

Peter Krauth Sees Higher Gold Ahead, In Par Due To Banks

In a wide-ranging interview with William Patalon III, Peter Krauth gives several reasons why gold is going to $5,000/oz in the longer term and is also veering in on a shorter-term leap. One of the reasons he brings up isn't mentioned by many: U.S. banks are moving into commodities in a big way.
Q): You've talked about your proprietary "Gold Spike Indicator" (GSI) market-timing signal? Can you give us a basic explanation of what that is and how it works and explain the "window of opportunity" that it identifies?

Krauth: Well, since the financial crisis, some of the largest U.S. investment banks have converted into bank holding companies. That means they must file quarterly reports on their holdings, including gold and other commodities. What I've repeatedly noticed is that, for a certain amount of time before, during and after these quarterly reporting dates, gold has moved up significantly.

(Q): So exactly what is your "Gold Spike Indicator" saying right now ... or what do you expect it to say? How long will this window be open this time around?

Krauth: This window is usually open for about three to four weeks. That's not a long time. It's important to ensure you're properly positioned in time to benefit. This time around, I'm expecting the GSI to indicate that the next two to four weeks are likely the best time to get positioned in both gold and silver, as both those metals could begin to spike soon after that.

As you know, the fall tends to be the strongest period of the year for precious metals prices. What's interesting this time around - because GSI provides a signal four times a year - is that precious metals go through their weakest period in the summer months of June, July and August. That means we could be setting up for an even bigger spike this time around. And that's really exciting.

(Q): You've written extensively about the bullish, long-term prospects for commodities. As part of that, you've uncovered a promising new development in the resources area: It involves banks - especially big investment banks - taking physical control of commodities. Just what is it that we're seeing here? And isn't this an element of your "Gold Spike Indicator?"

Krauth: That's correct - this is part of the GSI. Keep in mind that a large chunk of profits that big banks report these days come from trading. But much of that trading isn't even that risky, it's just leveraged so highly it pays off very, very well. As we know, banks can borrow pretty cheaply these days with interest rates at microscopic levels. But it goes deeper than that. These banks have made strategic moves to "control" many of the commodities they trade.

What I mean by this is that they are no longer just "paper trading" commodities through futures contracts. This began a couple of years ago with the creation of exchange-traded funds (ETFs) that were physically backed with such commodities as gold, copper or silver, to name just a few.

JPMorgan Chase & Co. (NYSE: JPM) and Goldman Sachs Group Inc. (NYSE: GS) have begun taking physical delivery of gold when their futures contracts mature. Last August, Morgan Stanley got the okay to trade with Dubai Gold Securities, which will allow it to take physical possession of the gold.

Earlier this year, Goldman and JPMorgan each bought established metals-warehousing facilities. Goldman purchased Metro International of Detroit for $550 million, and JPMorgan bought Henry Bath of the United Kingdom as part of a larger $1.7 billion acquisition. According to industry insiders both deals were done at a premium. These guys aren't paying premiums unless they foresee higher prices.

As for profiting from a future rise, Krauth likes gold stocks - particularly, mid-tier producers and exploration stocks with multi-million ounce deposits.

Russian Gold Production Falls By 3.41%

According to a brief report in the Automated Trader, Russian gold production from January to June of this year fell 3.41% from the same period last year. This small fall occurred despite significantly higher gold prices.


Russia's central bank is still adding gold to its reserves, so net exports from the country must be falling unless demand from the Russian public has fallen by a greater amount than central bank purchases plus the production shortfall.

Large Commercial Net Shorts Plunge

That's what an analysis of recent Commitment of Traders reports shows to Gene Arensberg of GotGoldReport. His tracking of large net commercial short positions shows a large drop of 25.6% over the past three weeks. The last three-week period with a larger drop was in August of 2008, just before the financial crisis. Long commercial net short positions as a percentage of total open interest also dropped quite briskly in the last week.
The drop in LCNS outpaced the drop in open interest at a roughly 4:1 pace in the week ending last Tuesday. And when we see that, it suggests that the largest "paper gold" sellers are aggressively closing out their "hedging".

As gold sold down from the $1260s to the $1170s, please note that the LCNS:TO has fallen to its low of the year, and this is the first time the LCNS:TO has fallen below 39% since December 9, 2008 – back amid the post-Lehmans panic.

The fact that the LCNS:TO has fallen so far on what is essentially only a modest, roughly 7% pullback for Gold Prices suggests a major shift is underway in the futures market. We view the current LCNS:TO of 38.6% as considerably more bullish than bearish. The largest commercial traders, as a group, seem to be rushing to cover or offset their net short positioning as gold consolidates in the $1170-1210 range.

That doesn't necessarily mean that gold won't continue to sell off even more. It can and it might. But these date certainly do mean that the largest "hedgers" and short sellers of paper gold have closed out a substantial amount of their collective net short positioning on what amounts to a net $50 drop in the Gold Price, as measured on Commitment of Traders reporting Tuesdays.
The neat thing about this finding is, it works as a contrarian indicator whether or not the big commercial shorters are manipulating the market. If not, if the large net short position on Comex is hedged elsewhere, then it signifies a lull in demand that might reverse later.

June New Home Sales Rebound More Strongly Than Expected

New home sales in the U.S. rose by a greater amount than expected last month: they jumped by 23.6% above the downwardly-revised May figure of 267,000, to 330,000. Economists were expecting a smaller rebound, to 315,000. Inventories of unsold new homes shrunk a little.


Gold didn't take the news all that well. From around $1,188 around the time the news was released at 10:00 AM ET, the metal plunged to as low as $1,179.70 before rebounding a little to around $1,182.

Indian Gold Buying Pulls Back Somewhat

According to a report by the Economic Times, Indian gold buying eased from Friday's levels as lower prices are still being waited for.
"Today sales are down, but Friday we did good volumes at $1,187-1,195 (an ounce)," said a dealer with a state-run bullion dealing bank in Mumbai. "There was activity on Friday evening but today there are enquiries, but nothing is materialising," said another dealer with a private bank....

Traders and dealers said the recent correction in prices seems to have pushed up sales in July as traders replenished stocks for the upcoming festivals, which will last till November. "I ended up booking 5 times more for shipments than last month," said the dealer at the state-run dealer. "I have plenty of orders below $1,900 (an ounce)," said the private bank dealer.
Also mentioned in the article was a forecast of somewhat higher level of imports into India this year as compared to last year's 480-490 tonnes.